
25 Nov
2025
25 Nov
'25
2:41 p.m.
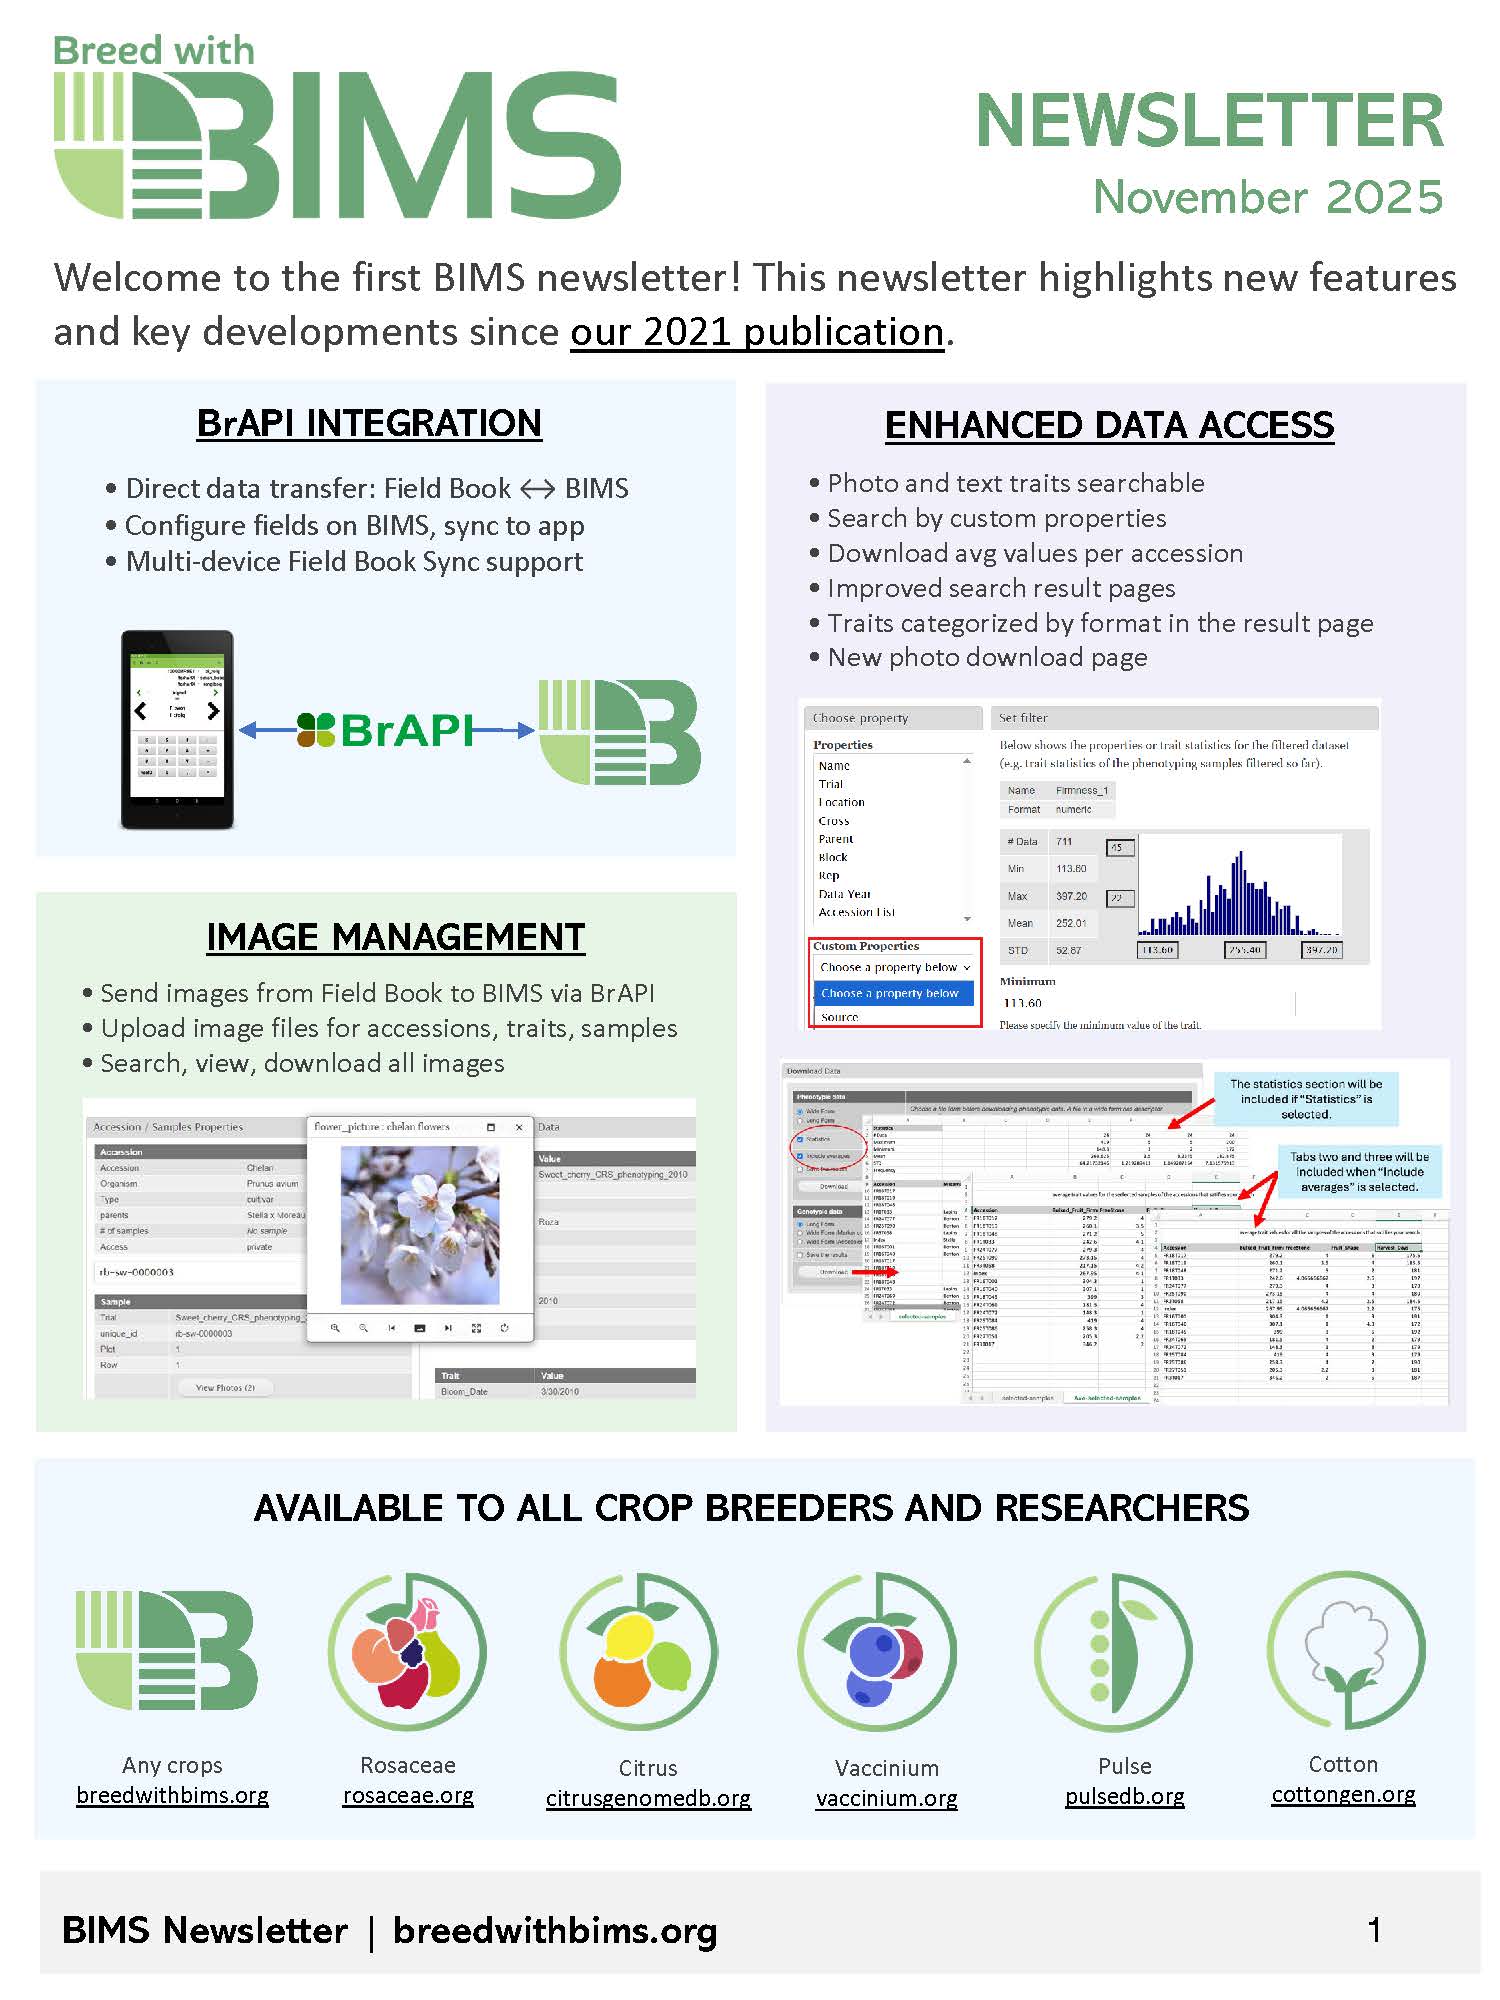
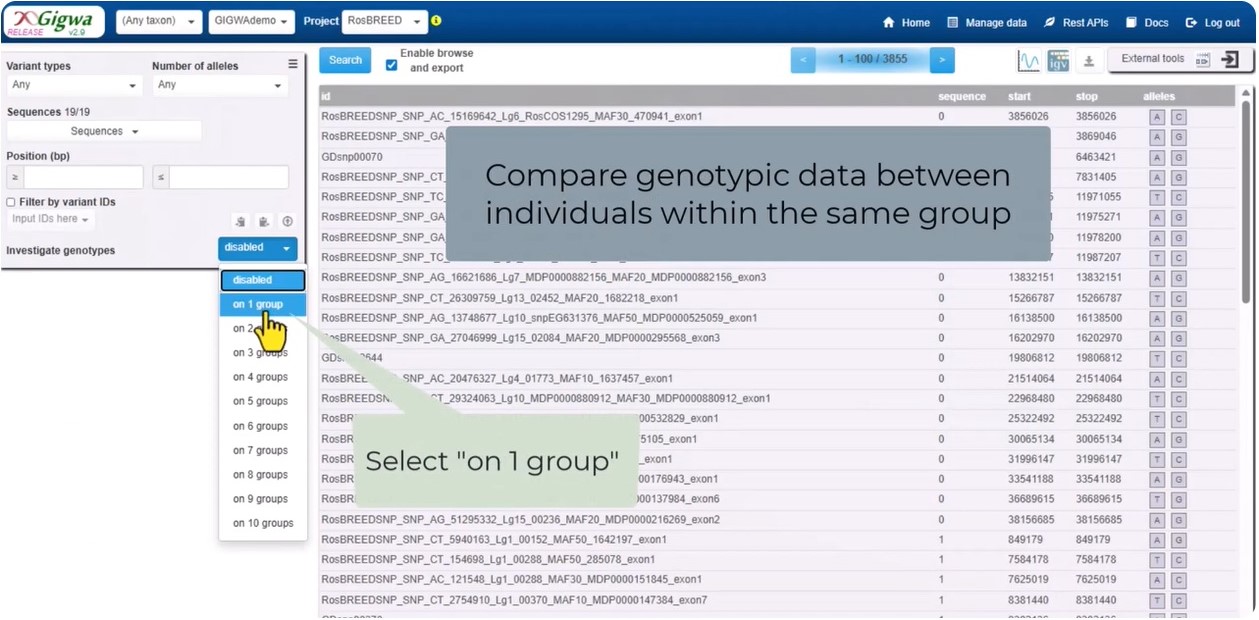
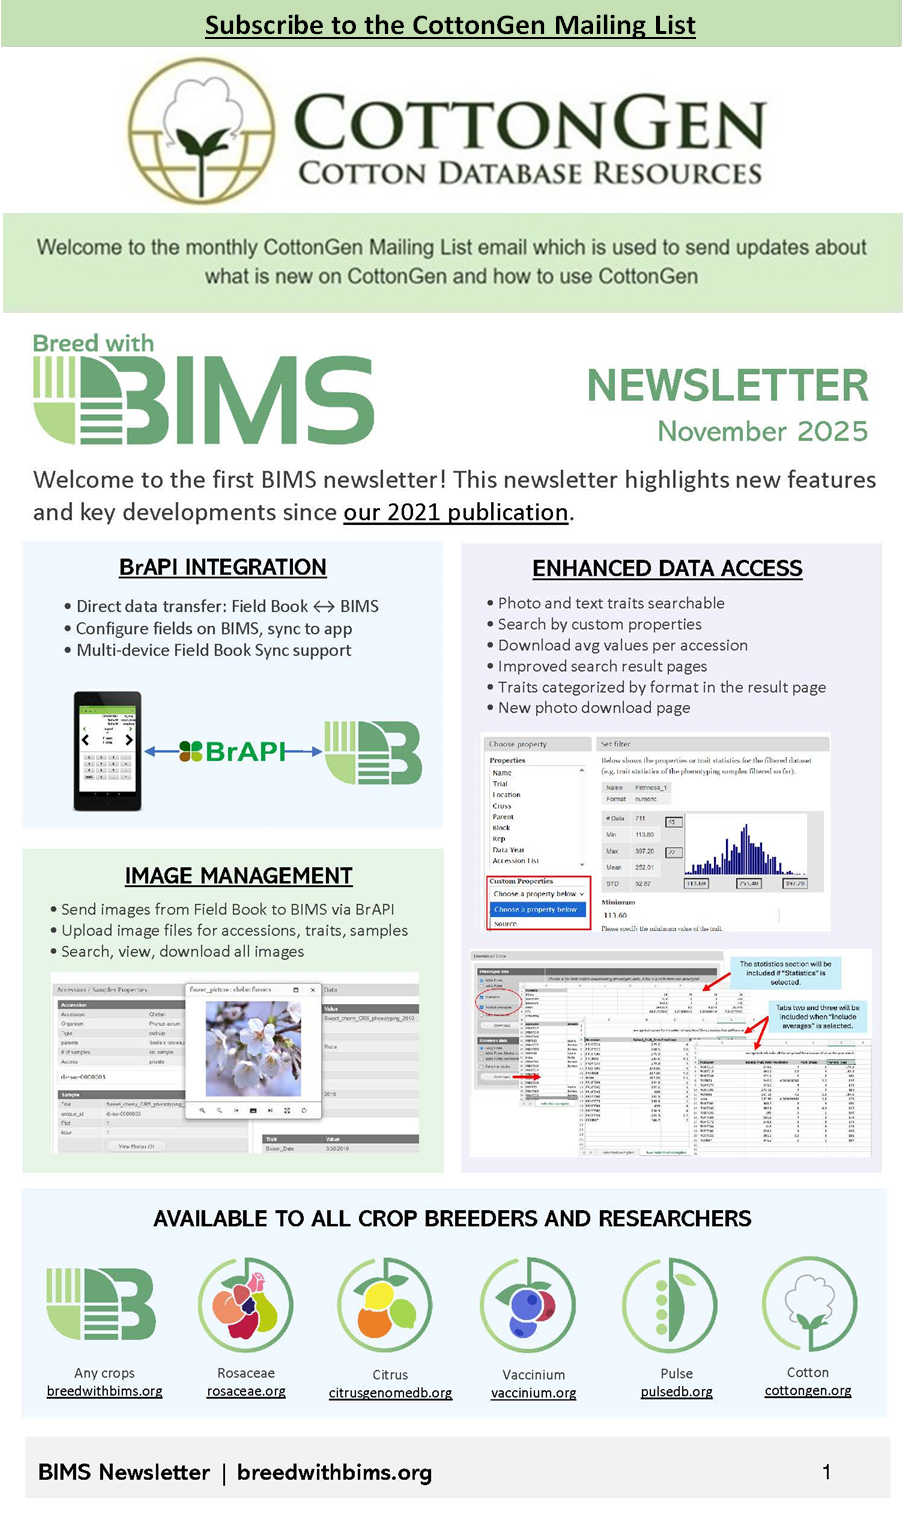
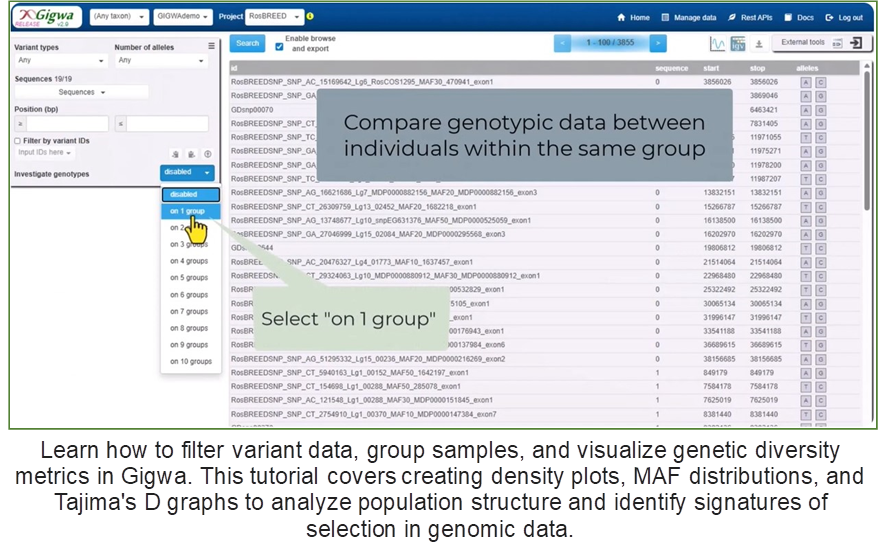
[A close up of a logo Description automatically generated,Subscribe to the CottonGen Mailing List,A close up of a logo Description automatically generated,A screenshot of a computer Description automatically generated,Subscribe to the CottonGen Mailing List] [New Gigwa Short Video Tutorial! How to Filter, Compare, and Visualize Genomic Variation in Gigwa]https://youtu.be/UnajH4KUcIc [A screenshot of a computer Description automatically generated,Learn how to filter variant data, group samples, and visualize genetic diversity metrics in Gigwa. This tutorial covers creating density plots, MAF distributions, and Tajima's D graphs to analyze population structure and identify signatures of selection in genomic data.]